General Topic
The ultimate guide to digital dashboards
Jun 24, 2020


General Topic
Digital dashboards are the most accessible way to present data. Break down your digital dashboard by specific areas like email or marketing or get a quick overview of your current marketing efforts in the forms of simple charts and graphs.
Why does this work well? Because our brains are great at spotting patterns, and this is made even easier if these patterns are presented visually.
Digital dashboards deliver all your in-depth data and break it down into a simplistic and easy to understand display.
Digital dashboards are great for displaying large, intimidating data sets colourfully and transparently, making it clearer to spot any patterns or trends.
Learn more about the benefits of using digital dashboards, ideas on designing a digital marketing dashboard template, as well as our easy tips on creating awesome digital dashboards that will wow your teammates.
What is a digital dashboard?
Digital dashboards are a fantastic way to get a quick overview of the performance of your company. You can create a digital dashboard on specific goals or general areas, for instance, a social media dashboard or general marketing dashboard.
An official digital dashboard definition, from Technopedia, is, “A digital dashboard is an electronic interface used to acquire and consolidate data across an organization. A digital dashboard provides in-depth business analysis while providing a real-time snapshot of department productivity, trends and activities, and key performance indicators, etc.”
This digital dashboard definition is a little complicated. In other words, marketing dashboards provide an easy solution to viewing all your data in one straightforward layout.
Digital dashboards work by displaying key data on a digital dashboard as simple bar charts, line graphs, or tables. The users can then easily track the performance of the business against any goals or targets they have.
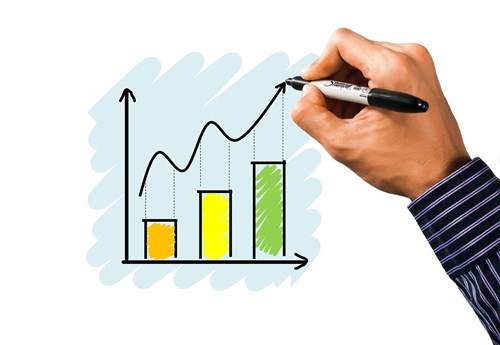
Digital dashboards bring up the most important/relevant data and help improve your business through visual aids. An example would be like this:
Creating a digital dashboard with key performance indicators is simple since digital dashboards are completely customisable. So, depending on how you design your dashboard, you can choose whatever key performance indicators you see fit.
To make your dashboard even easier to understand, you can utilise either a green up arrow or upturned triangle to indicate an increase in, for example, the number of sales. Likewise, you can use a red downward-facing arrow or triangle to show a fall or drop in sales.
How digital dashboards can benefit your business
Speed up decision making
Due to the nature of digital dashboards, you can immediately understand key data. This is ideal for making fast, data-driven decisions, providing yourself or your team an accessible way to make important decisions based on deep analytical information.
Easy to access
Since your digital dashboard displays simple, uncomplicated visuals, it reduces the need for intensive staff training.
The whole point of digital dashboards is to make data straightforward and easy to understand – making large, overwhelming data sets more clear, concise and, overall, less intimidating.
Increase your mobility
Since digital dashboards are customisable and can be tailored to individual businesses, you can present key relevant information in one platform or dashboard.
Most digital dashboard software is easily accessible through different devices, like smartphones or tablets for instance, via an app.
This multi accessible feature is ideal if you find yourself travelling regularly for work, as you can access information wherever you are in the world.
Optimise and grow your business
A digital dashboard with key performance indicators (KPIs) give you access to real-time data and can offer predictive forecasts on the future performance of the business.
Digital dashboards are an effective tool to enhance your business’s growth, expansion, and development by clearly defining and specifying your KPIs leading to steady and stable growth.
Benchmark your goals
The most effective way to meet your goals is to set clear, realistic objectives and benchmarks. Utilising the KPI feature on digital dashboards will help you achieve and reach your goals.
By providing you with the most accurate and up to date data, you gain a deeper understanding of what needs to be done and when it needs to be done to achieve your goals.
Communication is key
Silo organisations are not the best for driving innovation, creativity or productivity. To boost these metrics, consider opening the communication flow between departments.
Using a digital dashboard is an effective way for departments to discuss and share data and encourage communication.
This is essential for businesses, where breaking down communication barriers is key to the success of the company.
Choosing the correct digital dashboard software
We’ve gathered a few digital dashboard examples for you to get a quick overview or draw inspiration from. We’ve briefly covered their key benefits and other features, but feel free to click their links to find out more information:
Google Cloud
Google’s digital dashboard service is well-suited to a range of users, from IT developers to small business owners. The platform features an intuitive design and offers plenty of customer support in the forms of a 24/7 live chat and in-depth webinars.
Google offers a free version of the software and a free trial of the paid service. Want to know about this platform? Then check out Google’s page here.
Salesforce Analytics
Salesforce digital dashboard service is great for every day, small to medium business users that want an easy overview of their business.
Slightly lacking in support compared to Google, but Salesforce offers online support and training material to help you on your way. You can see more details on Salesforce here.
Tableau
This US-based software is ideal for all different business owners who want to track their KPIs. Just like Google, Tableau offers a free version of its services and free trial.
Their easy drop and drag feature allow you to create simple and straightforward digital dashboards.
Find more information on Tableau’s site here.
Agency360
With the Agency360 platform, you can create digital dashboards that communicate data swiftly and efficiently. From small start-ups to larger firms, Agency360 can offer a smart and reliable method for displaying data.
Agency360 provides an easy to navigate digital dashboard, automated reporting software, and an innovative white labelling feature – all in one platform.
Find out more about Agency360 and start your 14-day free trial here.
How to create a digital dashboard template with digital dashboard examples
We have suggested a few ideas on the most common digital dashboard templates used by marketers.
You can easily create these templates with the Agency360 platform and display all your data in the most accessible way. Check out the digital dashboard examples below!
General digital marketing dashboard template
Having a general form of a digital marketing dashboard is a good trick to have up your sleeve. Think of it as a fall-back that you can rely on.
Nailing a general digital marketing dashboard template will ensure that you have the right foundation to cover any marketing campaign or analysis you may encounter in your career.
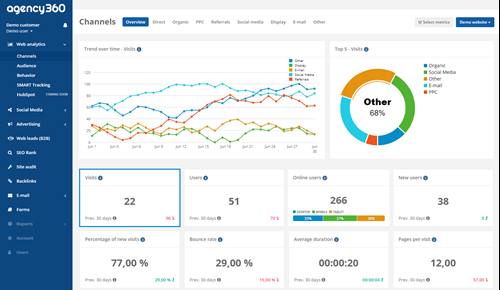
With Agency360, you can quickly view all your important data on the digital marketing dashboard screen.
Simply click web analytics, and then choose channels.
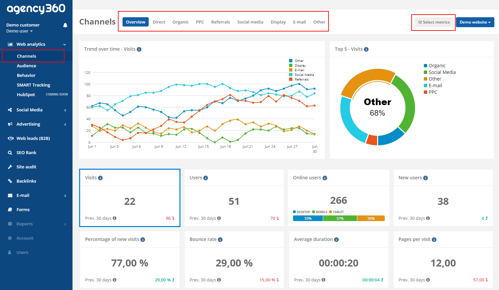
You will then be able to see an overview of all your visits from all channels.
To further filter this, you can select a different option along the top, for instance, direct visits or organic visits.
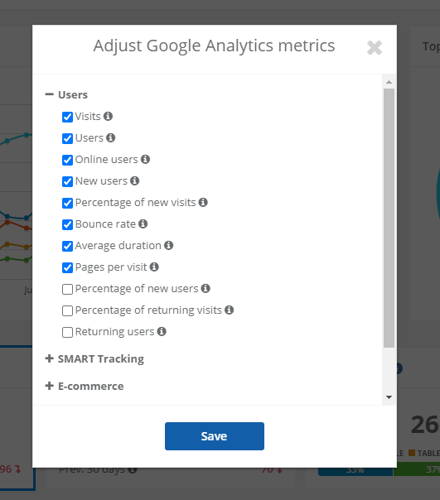
If you want to add even more data to this digital dashboard, you can simply click select metrics.
Here, you will be able to pick whichever metrics you would like to see displayed on your digital marketing dashboard.
Since this is a general digital marketing dashboard, you don’t have any specific goals, you just want to track your current marketing efforts.
In a general digital marketing dashboard, we recommend featuring data in your digital dashboard on SEO, PPC, social media, web analytics and emails. Save any specifics for a dedicated digital dashboard to avoid confusion and overloading your dashboard.
PPC (pay-per-click) digital marketing dashboard template
Another useful digital dashboard template to have in your repertoire is a PPC digital dashboard.
Quickly investigate whether your investment is working, or if you need to re-think your strategy.
For a PPC digital dashboard template, simply click advertising and click whichever ad medium you want to track. We have chosen Google Ads for this example.
Simply select your metrics at the top of the page and choose the parameters you want to measure for this digital dashboard. In a PPC digital dashboard, consider adding the following metrics:
- Overall performance
- Cost per click
- Conversions
- Revenue
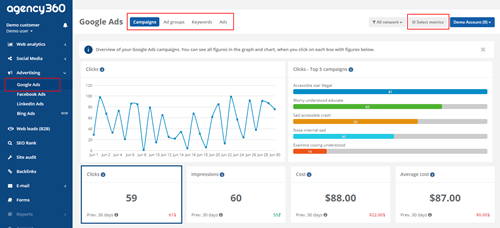
From here, you can simply customise the content of your digital dashboard template to track your specific marketing or campaign goals.

Email digital marketing dashboard template
HubSpot recently declared email marketing as the second most effective medium for building brand awareness. This is because email marketing allows you to communicate with your audience directly, making it one of the most powerful forms of online marketing.
When it comes to email marketing dashboards, try adding these metrics into your next digital marketing dashboard template:
- Number of emails sent
- Visits
- Inquiries
- Overall performance of the campaign in question
By tracking the performance of your latest email marketing campaign, you will get a better understanding of whether your email efforts are effective or if they need to be optimised.
3 quick tips for creating awesome digital dashboards
Remember these quick tips when designing your digital marketing dashboard to give you the best result.
1. Contrast and compare
When designing your digital dashboard, remember to compare your current data with a previous data set. For instance, compare today’s clicks with the number of clicks gained on the same day last year.
This will give some context behind the data and indicate the performance more effectively than a stand-alone result would.
2. Layout is key
With digital dashboards, you have the freedom to pick and choose your layout however you want.
A good way to create an easy-to-follow design is to keep your dashboard logical and in sections.
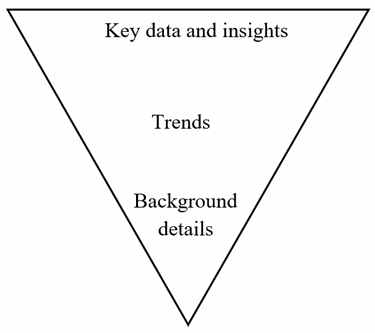
One idea on how to do this is to follow an inverted triangle shape.
Keep all your most important data/insights at the top of your dashboard, then display trends in the middle and then lastly, display any background information to give further context.
3. Keep it relevant
There’s nothing worse than trying to understand a cluttered screen, packed full of different graphs and charts.
A way to avoid this is to use only relevant data in your dashboard, creating a clean design.
Let’s say your digital dashboard is about your latest email marketing campaign. It makes sense to include all data concerning your email marketing performance – like the number of web visitors sourced from said email campaign.
It doesn’t seem logical to include irrelevant data like your customers’ in-store experience. Exclude any unnecessary data and, instead, fill the space with useful insights.
Interested to find out more on the Agency360 platform? Contact us here and start your 14-day free trial today.